Analyzing the A+ Learning Environment System

User Research Project

Deliverables: personas, user journey, key findings pitch
Methods:
online survey, face-to-face interviews, affinity diagrams
Tools:
Miro, Figma, Google Forms
Introduction
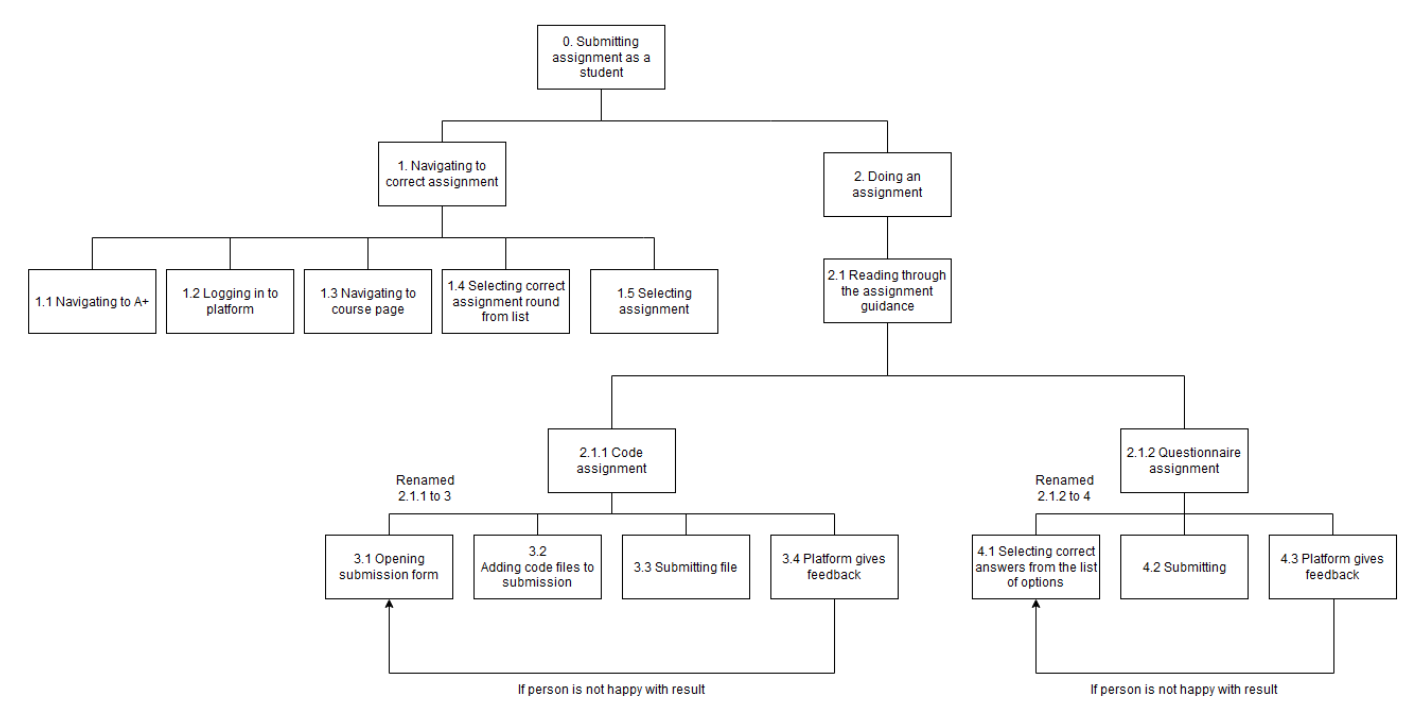
The goal of this project was to perform user research and data analysis for the A+ learning environment, from the student’s perspective. To begin with, A+ is an e-learning system where students can select from a variety of courses, mainly programming ones, and the system provides an interface for students to follow the course curriculum which can be divided in sections and assignments. So, what we set out to do, was to understand how the students actually use the system, the types of activities they perform on the platform, and finally, identify pain points and potential areas for improvements.
My Role
I was part of a four-person team, and actively involved in all stages of the project, including performing user interviews, analyzing data and creating the user journey and personas. Tasks were equally divided among the team members. Additionally, I was responsible for giving the final pitch of our improvement suggestions to the course staff.
User research
Online survey
The way we approached this research was, first of all, to distribute an online questionnaire to A+ system users, to gather feedback about their experiences and thoughts of the system.

Interviews
Additionally, we sat down and performed semi-structured interviews with 8 users, who had completed several courses using this system. During the interviews, we asked them to perform specific tasks on the system, while we observed them.
Data analysis

Firstly, we transcribed the available interviews, and started gathering key insights. Each member of our team went through each one of the transcripts, highlighting and coding comments about surprises, breakdowns, and other important and interesting points mentioned by the interviewees.
After that, we started adding all those findings as notes to a Miro board, without any specific order or grouping. We then started grouping similar information together, and the initial clusters were roughly created. We iterated through that process, until the point where each category was finally represented by similar and meaningful content.

With this strategy, we ended up with the five following categories:

Functionality:
Thoughts and comments regarding the existing functionalities and features of the A+ system. This category is divided into two sub-categories, Grading and Other Features, since grading itself is one of the most important features of the system and gathered a lot of insights.

Finding information in A+:
Insights related to how users can navigate the A+ system and how easy or hard it is to find specific information.

Social Interaction in A+:
Users’ thoughts  regarding interaction with other students or TAs directly from the system

Emotions:
How do the users of A+ feel when they are using the system?
General opinions about the system itself, or when visiting specific pages and courses.

New Ideas:
Suggestions and recommendations from the users about features that are missing and would be useful for them in order to use A+ more efficiently.

User Groups
Personas
User Journey
Task analysis


Finding information from A+ as a student:

Submitting assignments as a student:

“I want to see my grade”:

Key findings

After completing the research and the data analysis, we came up with certain findings.

While the users had an overall positive feeling after submitting an assignment, they also reported a number of issues:

  • Most of the users agreed that navigation was a bit cumbersome. They had difficulties in finding courses, especially old ones, and it was generally hard to find information.
  • Users reported that there was lack of social interaction. In order for students to communicate with each other and the TAs, they had to use external tools and this proved to add an extra burden to the interaction.
  • Students had trouble finding certain UI elements such as their grades or how to track their overall progress.
Suggestions for Improvements

During a pitching session with the course staff, we proposed some suggestions to address these pain points.
They included:

  • Adding a search functionality to make the information-searching process easier.
  • Implementing a way for students to communicate within the platform, for example, a chat functionality.
  • Improvements in the UI by ensuring that the grade is more visible and also reordering information hierarchy in the front page.